Discovery & Inventory
LangGuard automatically discovers and catalogs AI assets from your connected integrations, giving you a complete picture of your AI ecosystem. Discovery is the landing page when you open LangGuard — it's the first screen you see, summarizing every AI agent and model in your environment.
Overview
When you connect integrations like Databricks or Azure AI Foundry, LangGuard analyzes incoming trace data to:
- Identify unique AI agents
- Catalog models being used
- Track tools and APIs called
- Map dependencies between components
This happens automatically during sync - no manual configuration required.
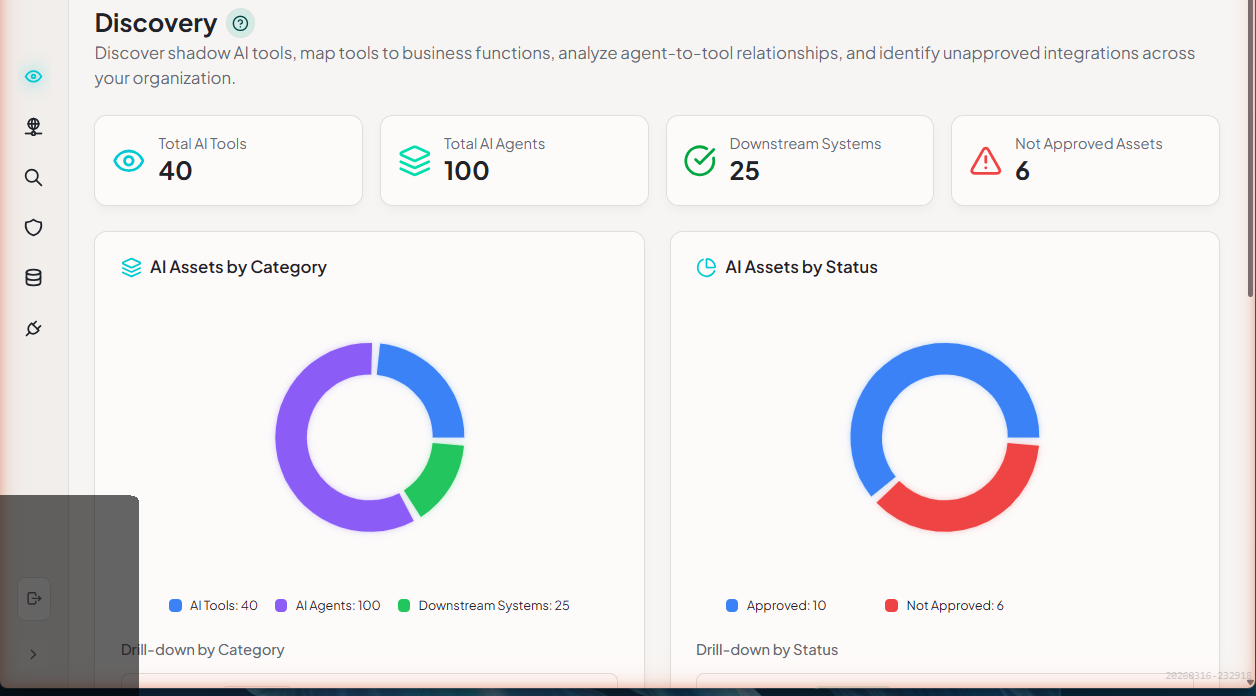
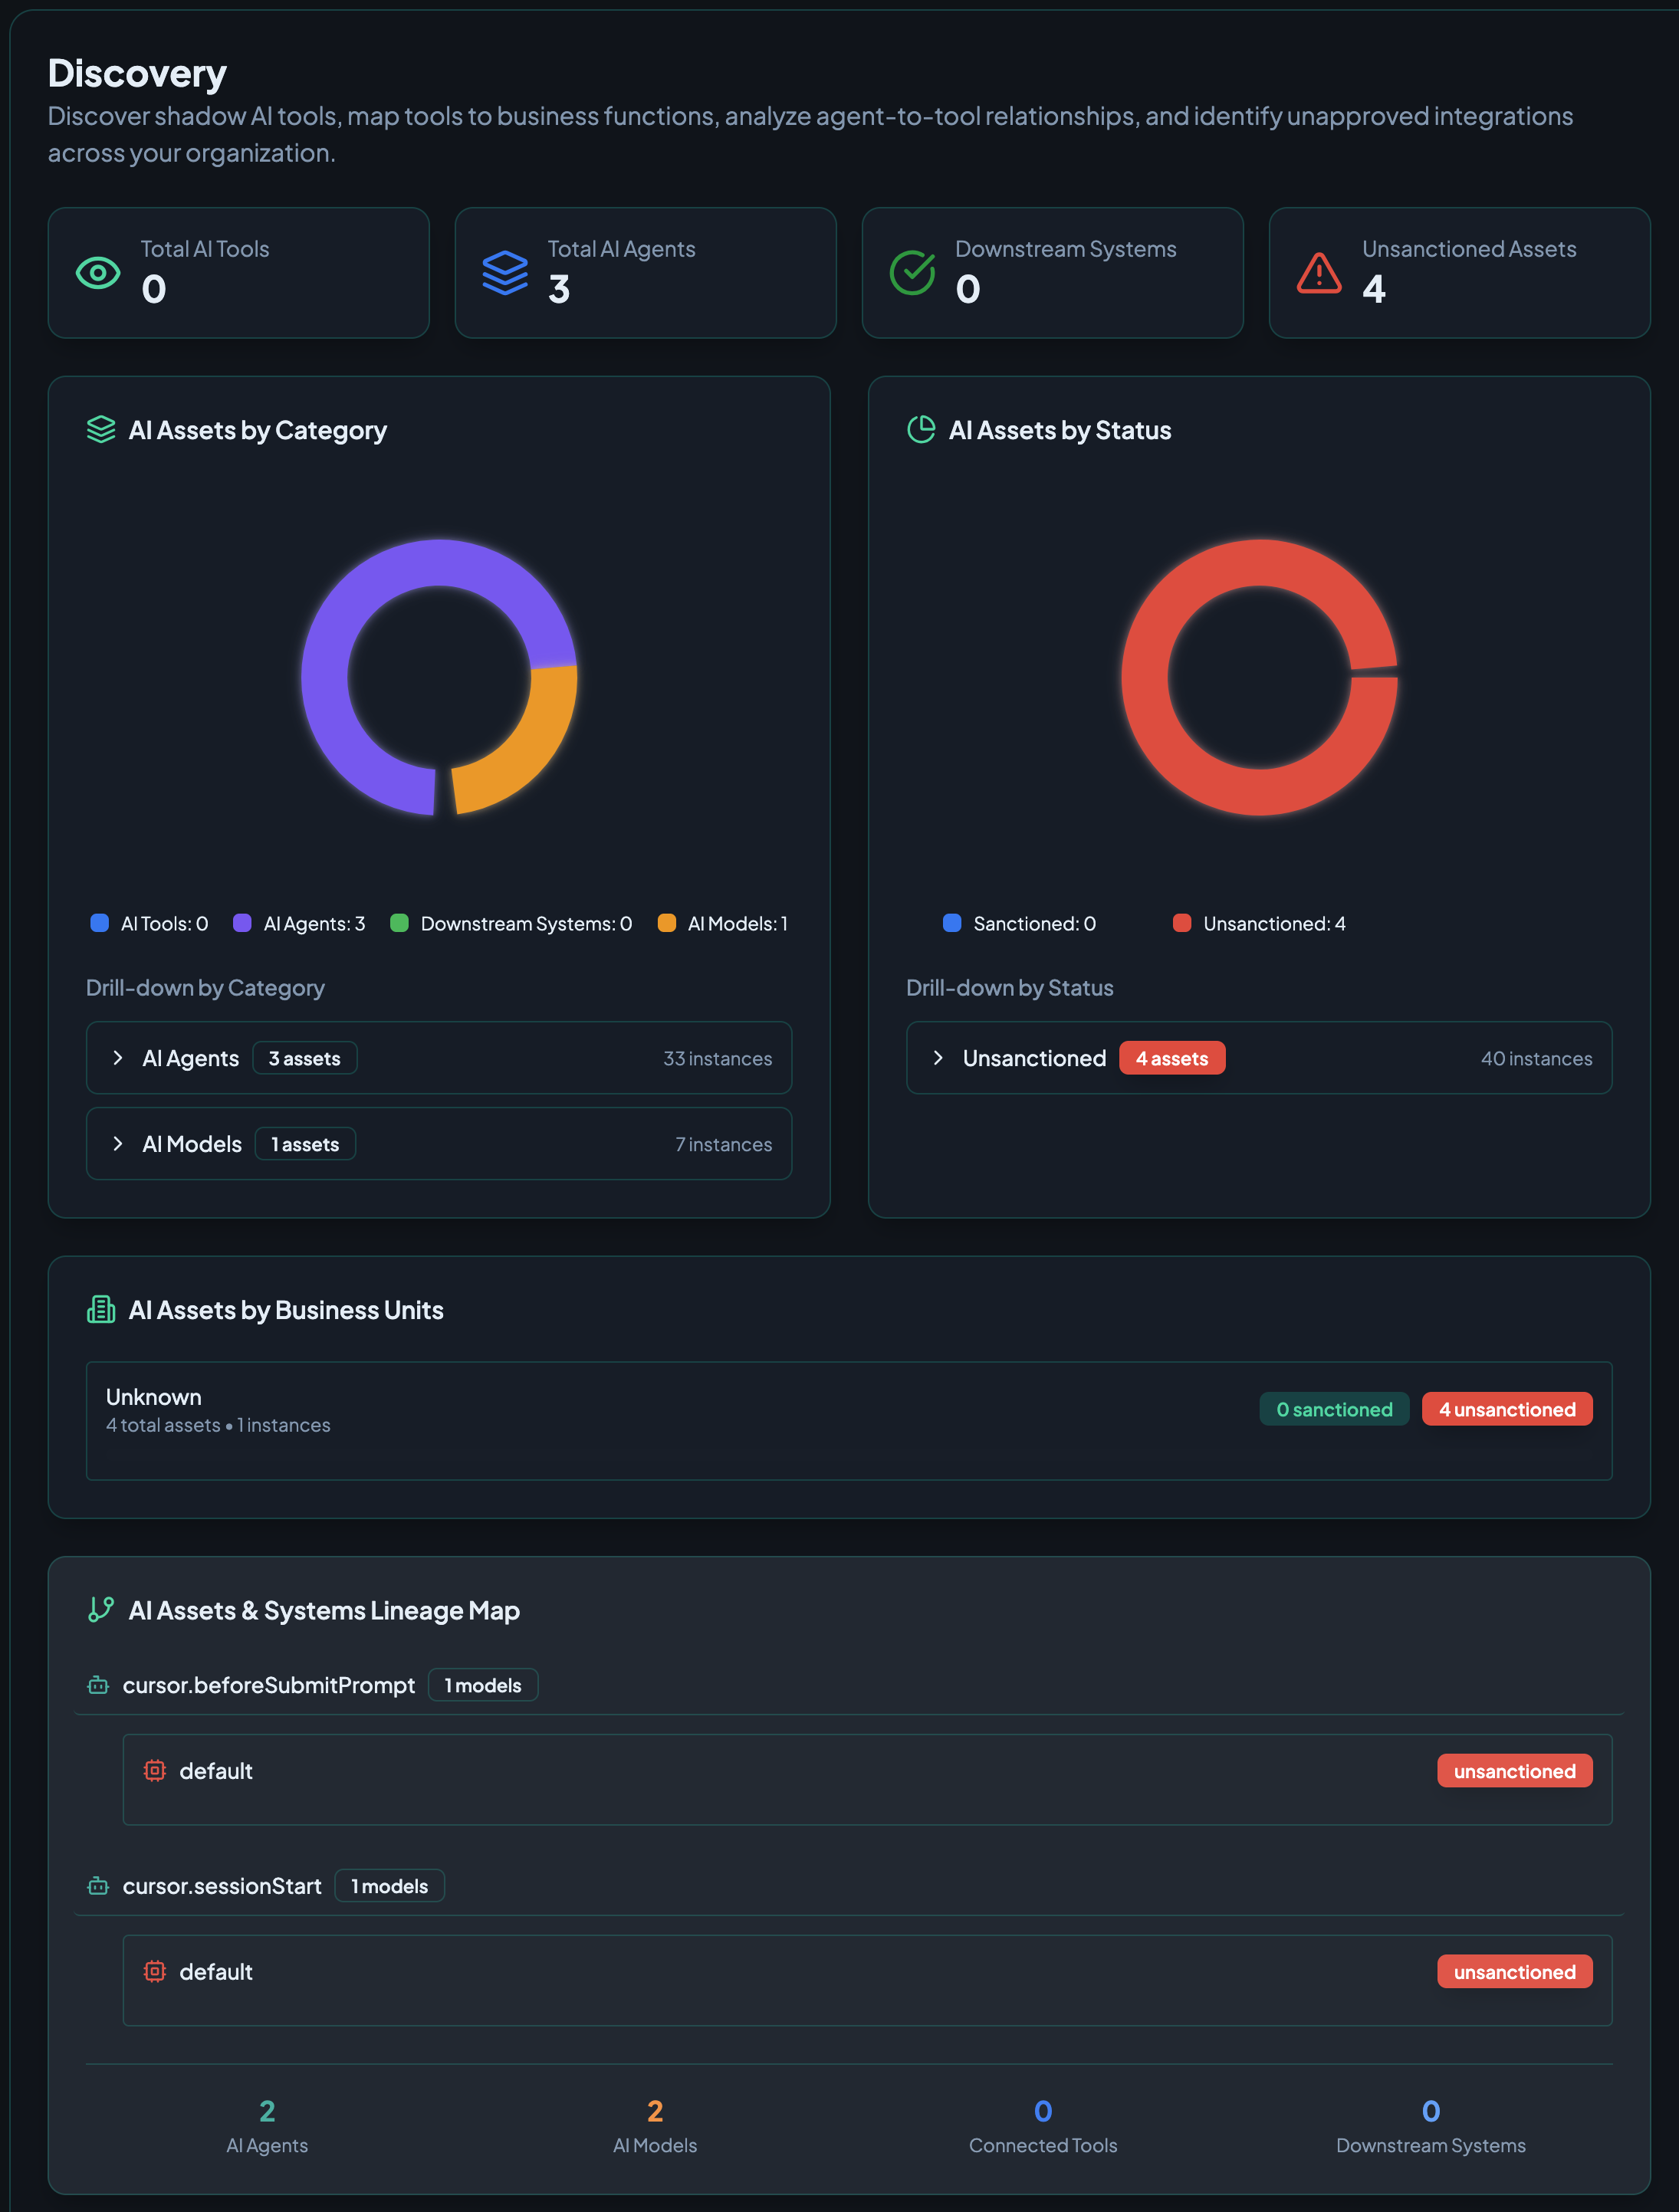
The Discovery dashboard displays:
- Summary cards - Quick counts of AI Tools, Agents, Downstream Systems, and Unsanctioned Assets
- AI Assets by Category - Visual breakdown of asset types with drill-down capability
- AI Assets by Status - Sanctioned vs. unsanctioned asset distribution
- AI Assets by Business Units - Asset allocation across organizational units
- Lineage Map - Visual representation of agent-to-model relationships
What Gets Discovered
Agents
Agents are identified from trace metadata and naming patterns:
- Agent Name - Extracted from trace attributes
- Agent Type - Chatbot, RAG, Autonomous, etc.
- First Seen - When the agent was first detected
- Last Active - Most recent activity
- Trace Count - Total executions
- Success Rate - Historical performance
Models
LLM models are detected from traces:
- Model Name - e.g.,
gpt-4,claude-3-opus - Provider - OpenAI, Anthropic, etc.
- Usage Count - How often it's called
- Token Consumption - Input/output tokens
Tools
Tools and external services called by agents:
- Tool Name - Function or API name
- Category - LLM, Vector DB, API, Database
- Usage Frequency - Call counts per agent
- Success Rate - Tool reliability
Downstream Systems
External systems agents interact with:
- Databases (PostgreSQL, MongoDB)
- APIs (Slack, Salesforce)
- Vector stores (Pinecone, Weaviate)
- Message queues (Kafka, Redis)
Browsing Discovered Assets
The Agent Discovery home
Discovery is the landing page of LangGuard (also called Agent Discovery). It presents every discovered asset as a browsable directory.
Use the Agents / Models toggle at the top to switch what you're looking at:
- Agents — group by team, owner, risk, system, or MCP server
- Models — group by provider or risk
Pick a layout — an org tree or swimlane view — to see how agents roll up to teams and owners. Each card shows the asset's status, recent activity, and key metrics; click a card to open its full details in the entity drawer.
Data Catalog
For Databricks and similar integrations, discovered entities appear in the Data Catalog:
- Catalogs
- Schemas
- Tables
- Columns (with metadata)
See Data Catalog for details.
How Discovery Works
1. Trace Ingestion
When traces are synced from integrations, LangGuard extracts:
{
  "trace_id": "tr_abc123",
  "name": "CustomerService Query",
  "metadata": {
    "agent_name": "CustomerService Agent",
    "model": "gpt-4",
    "tools": ["search_knowledge_base", "query_crm"]
  }
}
2. Agent Detection
The agent detection service analyzes traces to identify agents:
- Extracts agent identifiers from metadata
- Groups traces by agent
- Calculates aggregate metrics
- Detects patterns and anomalies
3. Dependency Mapping
Tool usage and API calls are tracked to build a dependency graph:
CustomerService Agent
    ├── OpenAI GPT-4
    │   └── 120 calls
    ├── Pinecone
    │   └── 45 calls
    └── Salesforce CRM
        └── 30 calls
4. Continuous Updates
Discovery runs continuously as new traces arrive:
- New agents are added automatically
- Metrics are updated in real-time
- Inactive agents are marked accordingly
- Dependencies are refreshed
Discovery Settings
Enable/Disable Discovery
Discovery is enabled by default. To disable:
- Go to Settings > Integrations
- Select your integration
- Toggle Auto Discovery off
Refresh Interval
Discovery updates with each sync. Adjust sync frequency to control freshness:
- Real-time: 1-minute sync interval
- Near real-time: 5-minute sync interval
- Periodic: Hourly or daily sync
Best Practices
1. Use Consistent Naming
Ensure your traces include consistent agent identifiers:
# Good - consistent naming
trace.set_attribute("agent.name", "CustomerService")

# Avoid - inconsistent naming
trace.set_attribute("agent", "Customer Service Agent")
trace.set_attribute("agentName", "customer-service")
2. Include Metadata
Rich metadata improves discovery accuracy:
trace.set_attributes({
    "agent.name": "OrderProcessor",
    "agent.version": "2.1.0",
    "agent.type": "autonomous",
    "model.name": "gpt-4-turbo",
    "model.provider": "openai"
})
3. Tag Environments
Distinguish between environments:
trace.set_attribute("environment", "production")
trace.set_attribute("deployment", "us-east-1")
Troubleshooting
Agents Not Appearing
- Check sync status - Ensure integration is syncing successfully
- Verify trace format - Confirm traces include agent identifiers
- Check filters - Remove any filters that might hide agents
- Wait for sync - Allow time for the next sync cycle
Duplicate Agents
If the same agent appears multiple times:
- Check for naming inconsistencies in your traces
- Standardize agent identifiers at the source
- Contact support for manual merge (coming soon)
Missing Dependencies
If tool usage isn't appearing:
- Ensure traces include tool/span information
- Check that tool calls are instrumented
- Verify the integration supports span data
Dashboard Views
The Discovery dashboard includes several summary views that provide different perspectives on your AI ecosystem.
AI Platform Usage Summary
See aggregated usage statistics per connected integration:
- Integration name and type
- Total traces ingested from each platform
- Active agents per integration
- Last sync timestamp and sync health
This view helps you understand which platforms are most active and whether integrations are syncing as expected.
User Access Summary
Understand who has access to AI assets across your organization:
- Users with access to each integration
- Access level per user (admin, member, viewer)
- Last active timestamp
- Asset count each user interacts with
Use this view to identify over-permissioned users or access that needs review.
AI Assets by Business Units
See how AI assets are distributed across organizational units:
- Business unit breakdown (by team, department, or custom grouping)
- Asset count per unit
- Approval status distribution within each unit
- Drill-down to see specific assets in each unit
This view is especially useful for governance teams managing AI adoption across a large organization.
Next Steps
- Data Catalog - Browse discovered entities
- Create Policies - Apply governance to discovered assets