Monitoring
LangGuard provides comprehensive monitoring capabilities to help you understand the health and performance of your AI operations.
Dashboard Overview
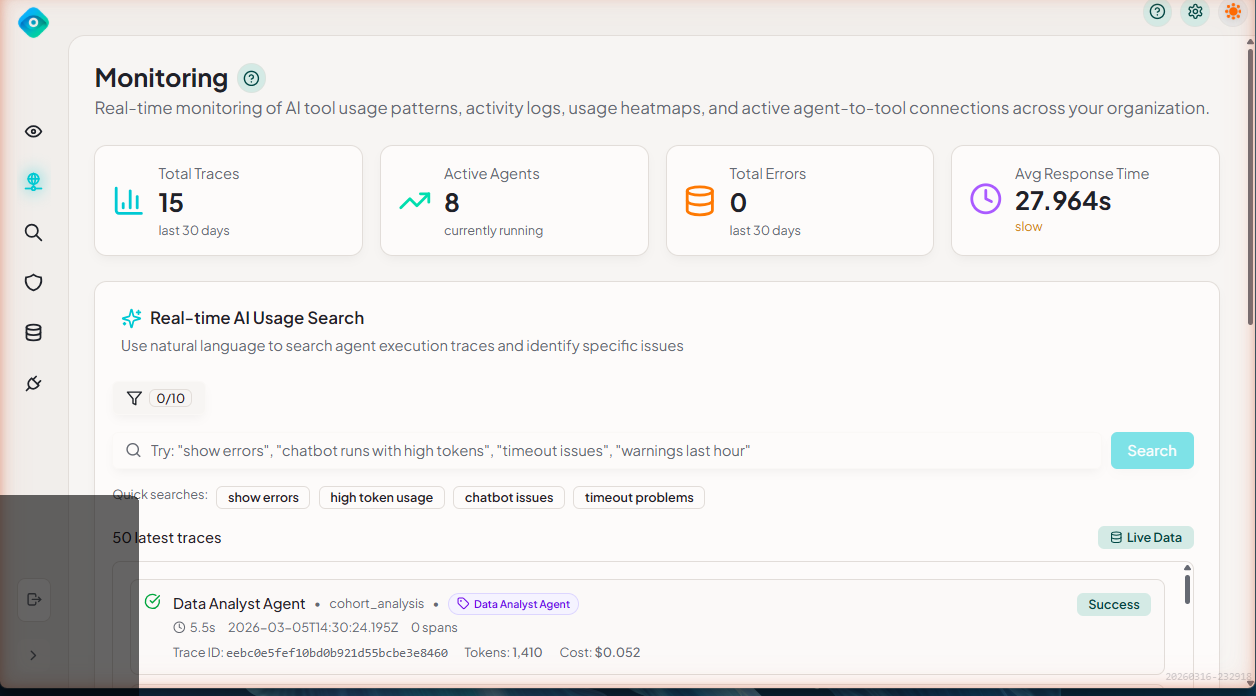
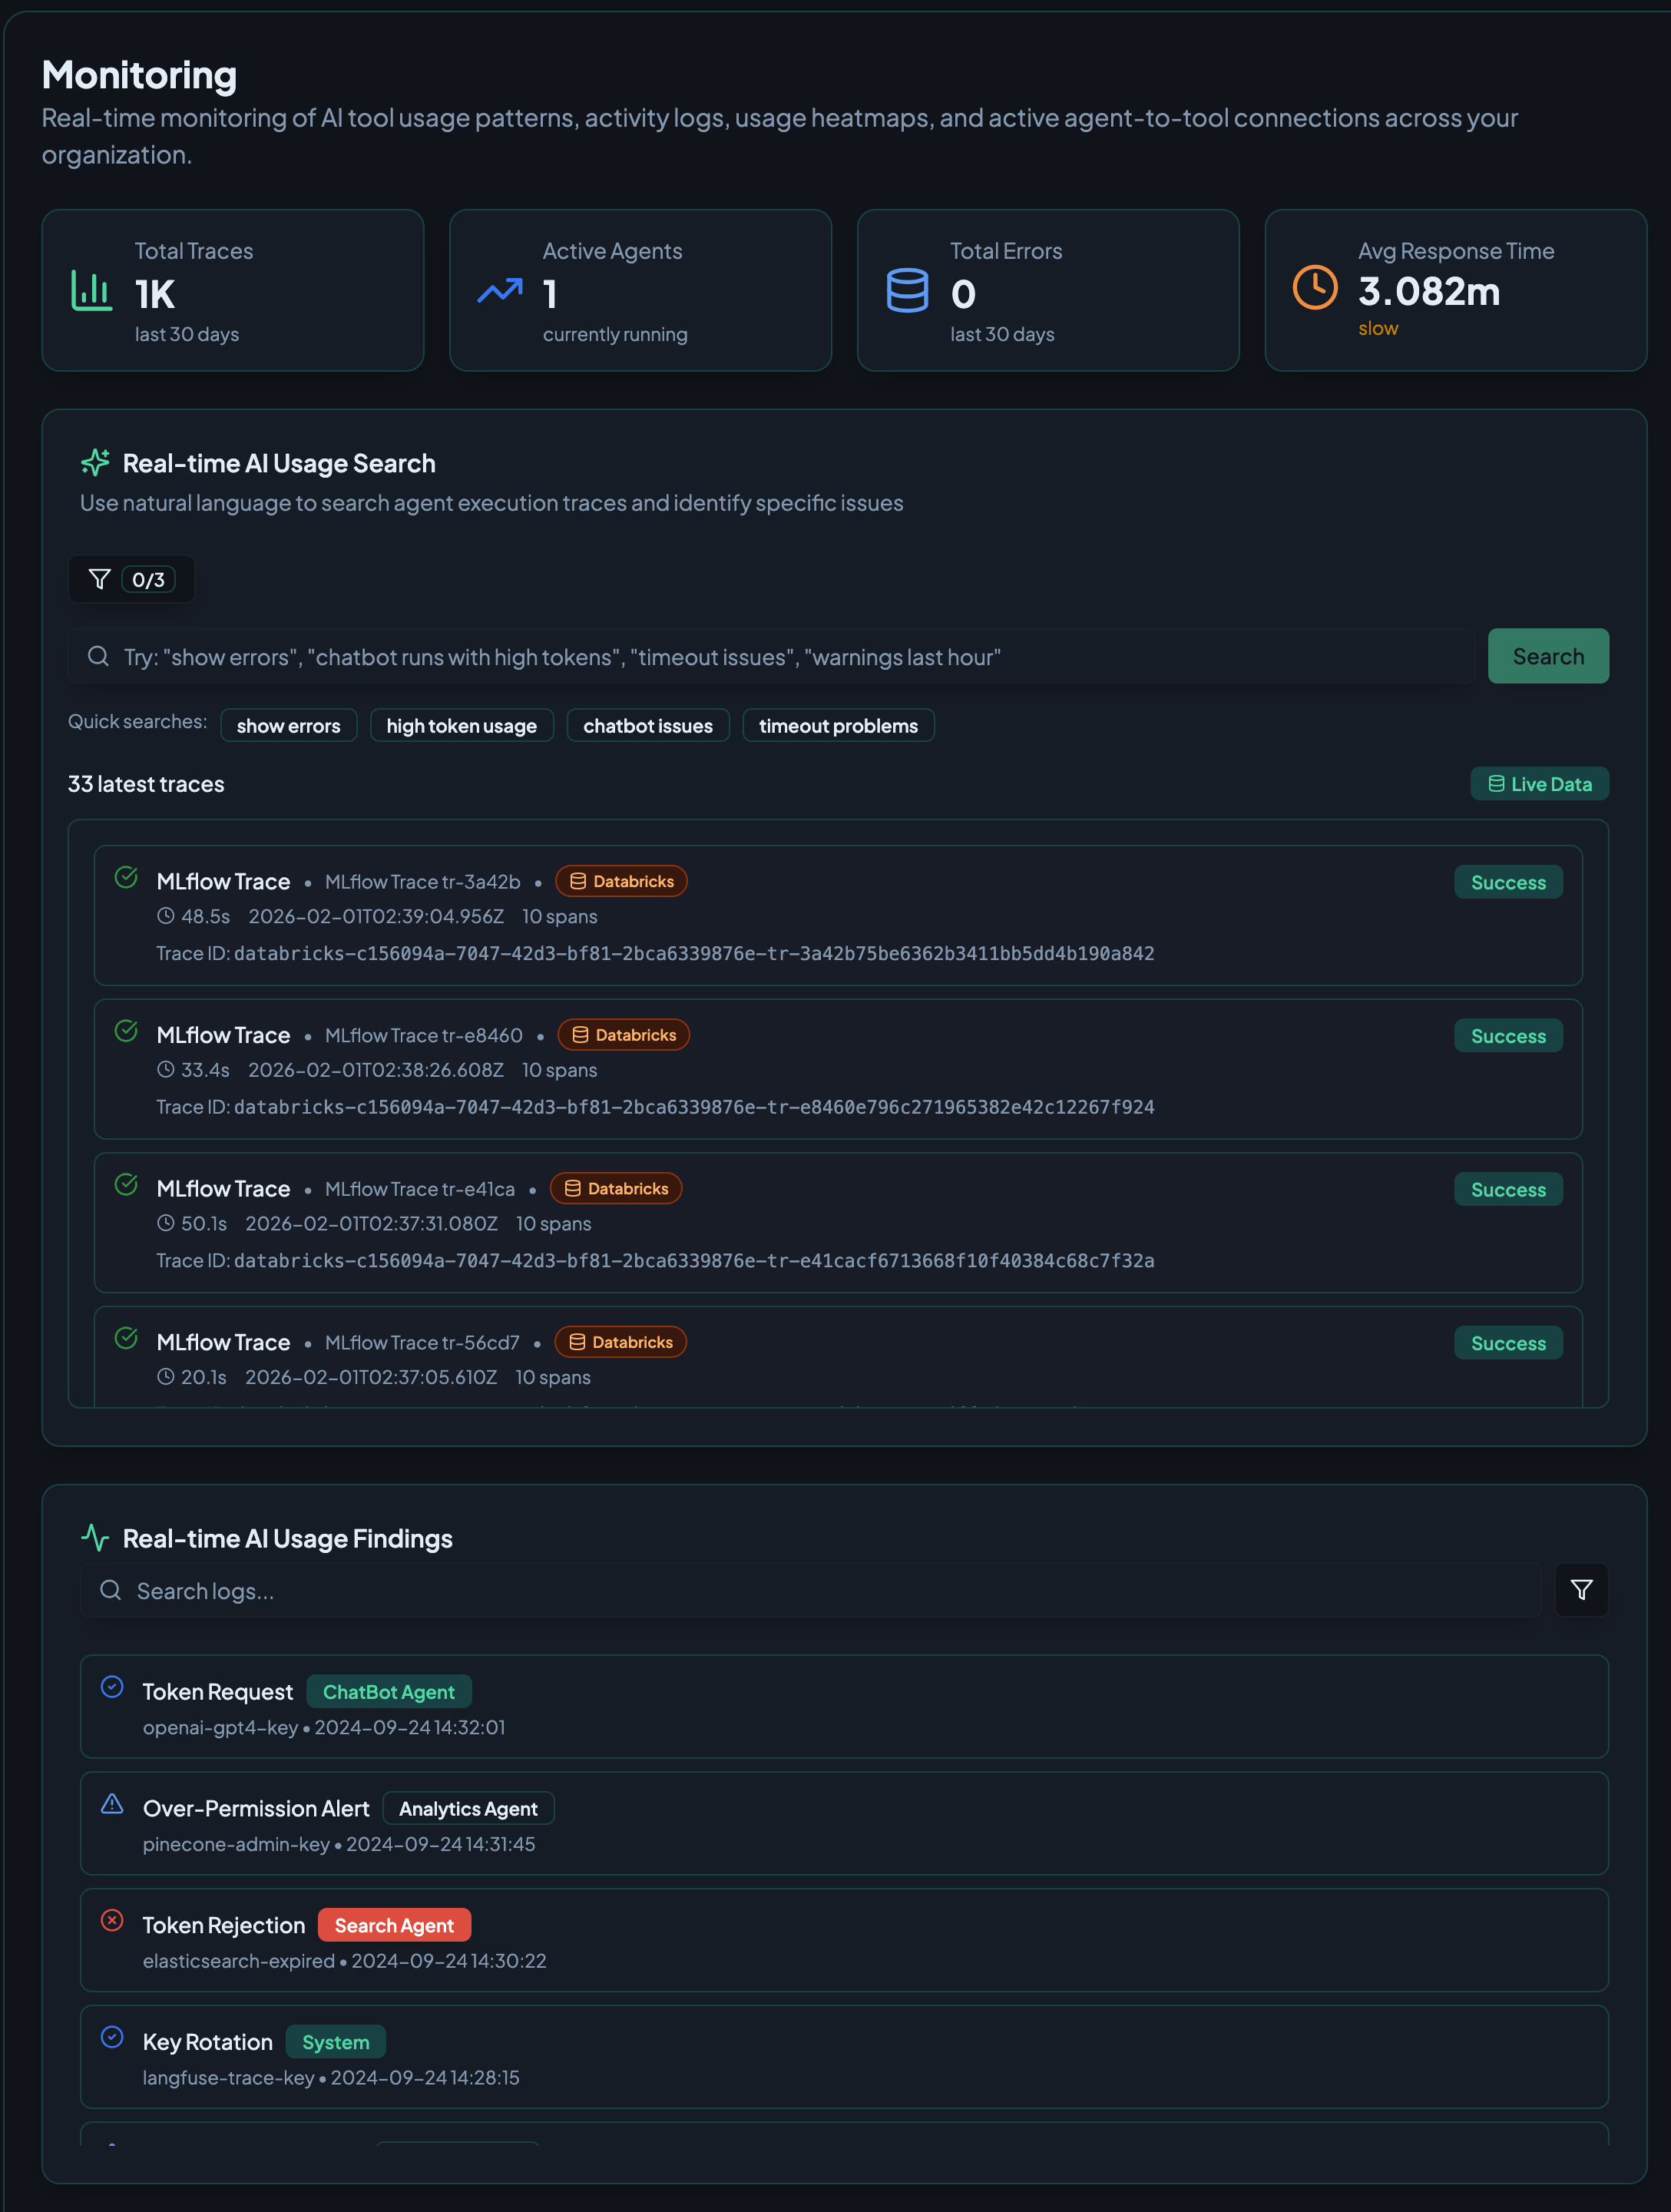
The main dashboard displays key metrics and recent activity at a glance:
- Summary cards - Total Traces, Active Agents, Total Errors, and Avg Response Time
- Real-time AI Usage Search - Natural language search for traces with quick search filters
- Latest traces - Live feed of recent agent execution traces with status indicators
- Real-time AI Usage Findings - Security and compliance alerts including token requests, permission alerts, and key rotations
Key Metrics
The dashboard header shows aggregate metrics:
| Metric | Description |
|---|---|
| Total Traces | Number of traces ingested |
| Success Rate | Percentage of successful traces |
| Avg Latency | Mean trace duration |
| Active Agents | Agents with recent activity |
| Policy Violations | Count of triggered policies |
Time Range Selection
Use the time range selector to adjust the analysis period:
- Last Hour
- Last 24 Hours (default)
- Last 7 Days
- Last 30 Days
- Custom Range
All metrics update automatically when you change the time range.
Metrics Deep Dive
Success Rate
The success rate shows the percentage of traces that completed without errors:
Success Rate: 94.2%
───────────────────────────────
████████████████████░░░░ 94.2%
Interpretation:
- ≥ 95% - Excellent (green)
- 85-95% - Acceptable (yellow)
- < 85% - Needs attention (red)
Latency
Track response times across your agents:
- P50 (Median) - Half of requests complete within this time
- P95 - 95% of requests complete within this time
- P99 - 99% of requests complete within this time
- Average - Mean duration
Latency Distribution (P95)
────────────────────────────────
< 100ms  ████████ 40%
100-500ms ██████████████ 35%
500ms-1s ████████ 15%
> 1s     ████ 10%
Token Usage
Monitor token consumption for cost management:
- Input Tokens - Tokens in requests
- Output Tokens - Tokens in responses
- Total Tokens - Combined usage
- Cost Estimate - Based on model pricing
Volume Trends
See request patterns over time:
Requests per Hour (Last 24h)
100 |                    ╭────╮
 75 |              ╭─────╯    ╰───╮
 50 |         ╭────╯              ╰───╮
 25 | ────────╯                        ╰────
  0 └───────────────────────────────────────
    12am   6am   12pm   6pm   12am
Agent Health
Agent Status Cards
Each discovered agent has a health card showing:
┌──────────────────────────────────────┐
│  CustomerService Agent         [●●●] │
├──────────────────────────────────────┤
│  Status: ● Healthy                   │
│  Success Rate: 94.2%   ▲ +2.3%      │
│  Avg Latency: 1.2s     ▼ -0.1s      │
│  Traces (24h): 1,234                 │
│  Last Active: 5 minutes ago          │
└──────────────────────────────────────┘
Health Status Indicators
| Status | Meaning |
|---|---|
| 🟢 Healthy | Success rate ≥ 95%, no recent errors |
| 🟡 Warning | Success rate 85-95% or elevated latency |
| 🔴 Critical | Success rate < 85% or many errors |
| ⚪ Inactive | No activity in selected time range |
Integration Health
Connection Status
Monitor the health of your data source connections:
┌─────────────────────────────────────────┐
│  Integrations                            │
├─────────────────────────────────────────┤
│  Databricks (Production)  ● Connected   │
│  Last Sync: 2 minutes ago               │
│  Traces Synced: 12,456                  │
├─────────────────────────────────────────┤
│  Azure AI Foundry         ● Connected   │
│  Last Sync: 5 minutes ago               │
│  Traces Synced: 3,421                   │
└─────────────────────────────────────────┘
Sync History
View recent sync operations:
| Time | Integration | Status | Items |
|---|---|---|---|
| 2 min ago | Databricks | ✓ Success | 45 traces |
| 7 min ago | Databricks | ✓ Success | 52 traces |
| 12 min ago | Azure AI Foundry | ✓ Success | 23 traces |
| 17 min ago | Databricks | ⚠ Warning | 0 traces (rate limited) |
Policy Violations
Violation Summary
The dashboard shows recent policy violations:
Policy Violations (Last 24h)
────────────────────────────────
Critical:  3  ████
High:      8  ██████████
Medium:   15  ████████████████████
Low:       7  █████████
Recent Violations
Quick list of recent policy triggers:
| Time | Policy | Agent | Severity |
|---|---|---|---|
| 5 min ago | PII Detection | EmailBot | Critical |
| 12 min ago | Metadata Tagging | ChatBot | Low |
| 1 hour ago | Credential Surface Discovery | DataAgent | Critical |
Click any violation to view details in the Trace Explorer.
Real-time Updates
Auto-Refresh
The dashboard automatically refreshes based on your sync interval:
- Metrics update after each sync
- Agent status refreshes in real-time
- New violations appear immediately
Manual Refresh
Click the refresh button (↻) to force an update.
Best Practices
1. Set Up Baselines
Establish baseline metrics for comparison:
- Document normal success rates
- Record typical latency ranges
- Track average daily volumes
2. Monitor Trends
Look for patterns rather than absolute values:
- Gradual latency increases
- Declining success rates
- Volume anomalies
3. Regular Reviews
Schedule periodic reviews:
- Daily: Quick health check
- Weekly: Trend analysis
- Monthly: Deep dive and optimization
Next Steps
- Trace Explorer - Investigate specific traces
- Policies - Set up governance rules