Trace Explorer
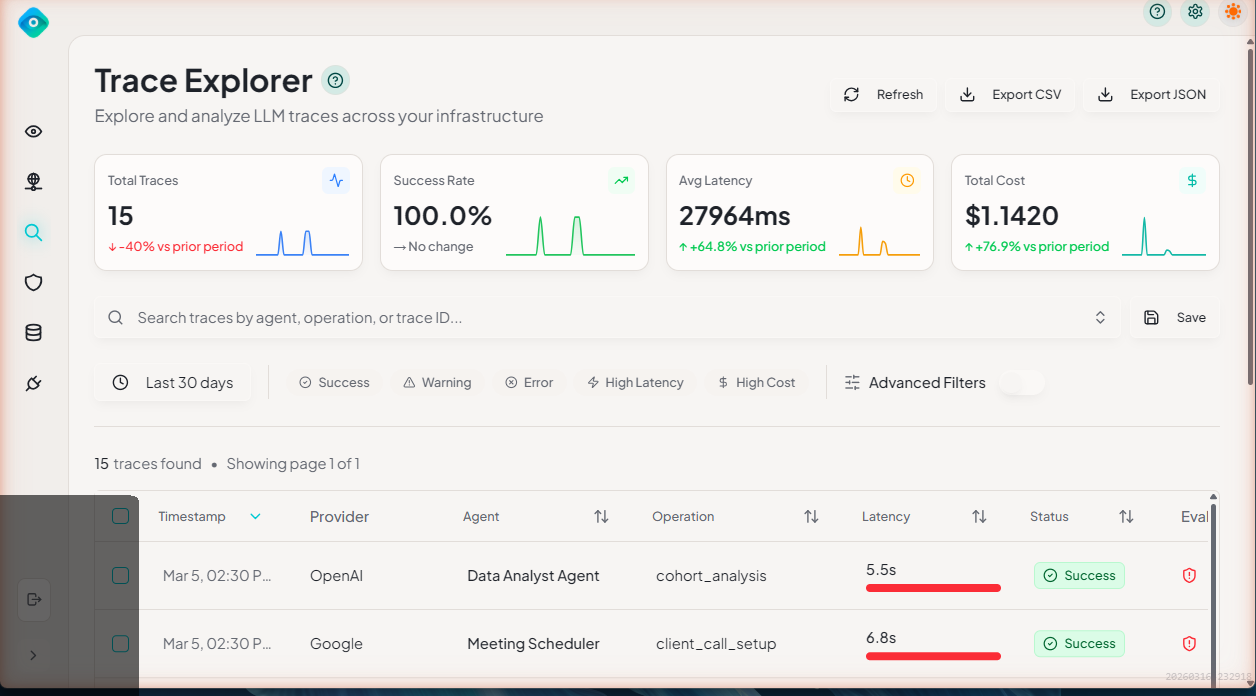
The Trace Explorer is your primary tool for investigating AI agent activity. Search across all traces, apply filters, and drill into details.
Overview
Access the Trace Explorer from the main navigation sidebar. It provides:
- KPI Summary Cards - Key metrics at a glance
- Table View - List all traces with sortable columns
- Advanced Filters - Narrow results by multiple criteria
- Detail Drawer - Full trace information without leaving the page
- Bulk Actions - Select and operate on multiple traces
KPI Summary Cards
At the top of the Trace Explorer, summary cards display key performance indicators for the current filter selection:
| Card | Description |
|---|---|
| Total Traces | Number of traces matching current filters |
| Error Rate | Percentage of traces with errors |
| Avg Latency | Mean duration across all matching traces |
| Total Cost | Estimated cost for all matching traces |
These cards update dynamically as you change filters or time ranges, giving you an instant overview before diving into individual traces.
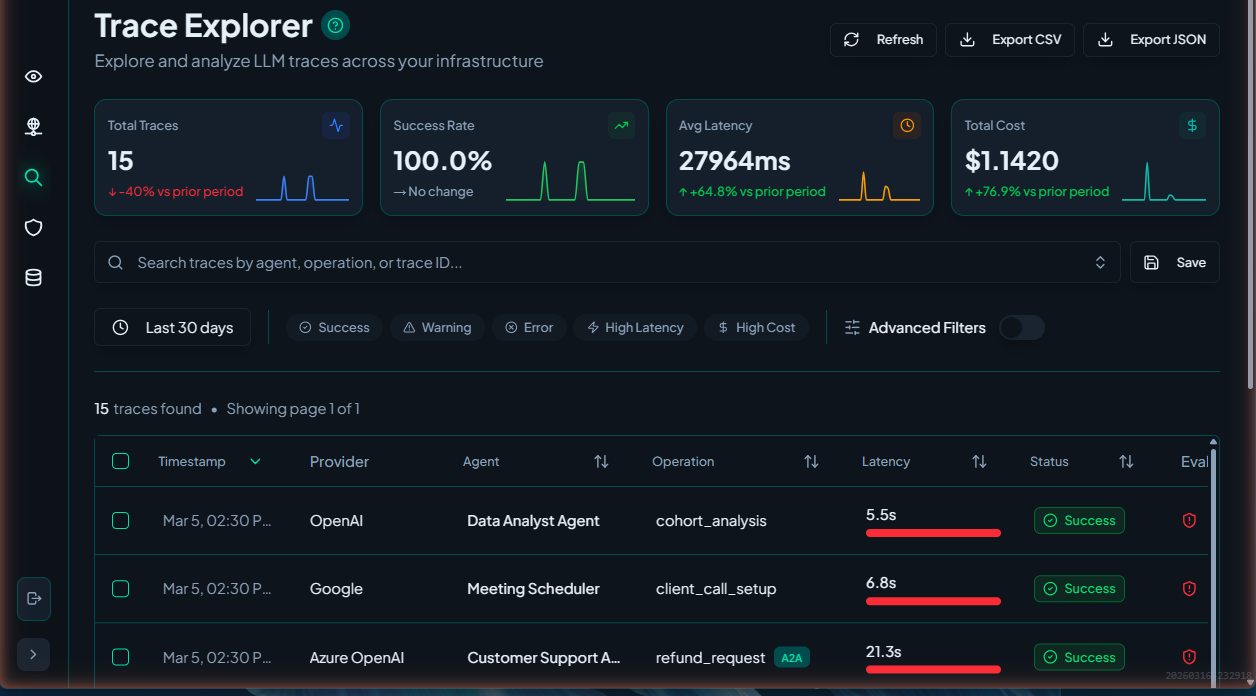
Table View
Columns
The trace table displays key information:
| Column | Description |
|---|---|
| Name | Trace/operation name |
| Agent | Agent that executed the trace |
| Status | Success, Warning, Error, or Blocked (denied by a policy) |
| Duration | Execution time |
| Tokens | Input + Output tokens |
| Cost | Estimated cost |
| Time | When the trace occurred |
| Source | Integration source (Databricks, Azure AI Foundry, etc.) |
Sorting
Click any column header to sort:
- Click once: Sort ascending
- Click twice: Sort descending
- Click third: Remove sort
Pagination
Navigate through results:
- Page Size: 25, 50, 100 rows per page
- Navigation: First, Previous, Next, Last buttons
- Jump to Page: Enter specific page number
Filtering
Quick Filters
Use the filter bar above the table:
┌─────────────────────────────────────────────────────────────────┐
│  🔍 Search...    Time: [Last 24h ▼]    Status: [All ▼]    ...  │
└─────────────────────────────────────────────────────────────────┘
Available Filters
| Filter | Options |
|---|---|
| Search | Full-text search across all fields |
| Time Range | Last hour, 24h, 7d, 30d, Custom |
| Status | Success, Warning, Error, Blocked, All |
| Agent | Select from discovered agents |
| Source | Filter by integration |
| Has Violations | Only traces with policy violations |
Advanced Filters
Click "Advanced" to access more filter options:
- Duration Range - Min/max execution time
- Token Range - Min/max token count
- Cost Range - Min/max cost
- Custom Attributes - Filter by metadata fields
Combining Filters
Filters combine with AND logic:
Time: Last 24 hours
AND Status: Error
AND Agent: CustomerService
Saving Filter Presets
Save frequently used filter combinations:
- Configure your filters
- Click "Save Preset"
- Name your preset
- Access from the preset dropdown
Search
Full-Text Search
The search box searches across:
- Trace name/operation
- Agent name
- Input/output content
- Metadata values
- Error messages
Search Syntax
Use operators for precise searches:
| Operator | Example | Description |
|---|---|---|
| Exact phrase | "customer query" | Match exact phrase |
| OR | error OR failed | Match either term |
| NOT | NOT test | Exclude term |
| Field | agent:ChatBot | Search specific field |
Examples
# Find traces with errors from ChatBot
agent:ChatBot status:error

# Find traces mentioning "payment" but not "test"
payment NOT test

# Find exact operation name
"process_order"
Trace Details
Opening Details
Click any trace row to open the detail drawer:
┌──────────────────────────────────────────────────────────────┐
│  Trace Details                                         [×]    │
├──────────────────────────────────────────────────────────────┤
│  CustomerService Agent                                        │
│  Operation: customer_support_query                            │
│  Status: ● Success                                            │
│                                                               │
│  [Overview] [Timeline] [Input/Output] [Metadata] [Violations] │
│                                                               │
│  ... (tab content) ...                                        │
└──────────────────────────────────────────────────────────────┘
Overview Tab
The overview is designed for glanceability, summarizing the trace across a few cards:
- Key metrics — trace ID, start time, duration, model, token usage, and cost
- Status — Success, Warning, Error, or Blocked when a policy denied the call
- Identity card — who made the call: the caller identity, its classification (human, NHI — non-human identity, or OBO — on-behalf-of), and the entity's approval status
- Policy violations — any violations raised on this trace, with severity
- Agent — the agent that ran the trace, shown as a link straight to its Data Catalog entity
Timeline Tab
Span breakdown showing execution flow:
customer_support_query [1.23s]
├── fetch_user_context [0.05s]
├── call_llm [0.85s] ─── OpenAI GPT-4
│   ├── input_tokens: 850
│   └── output_tokens: 400
├── query_knowledge_base [0.25s]
└── format_response [0.08s]
Each span shows:
- Name and duration
- Start/end times
- Attributes and metadata
- Nested child spans
Input/Output Tab
View the actual data:
Input:
{
  "user_message": "How do I reset my password?",
  "session_id": "sess_abc123",
  "context": { ... }
}
Output:
{
  "response": "To reset your password, follow these steps...",
  "confidence": 0.95,
  "sources": [ ... ]
}
Metadata Tab
Custom attributes attached to the trace:
agent:
  name: CustomerService
  version: 2.1.0
  type: RAG

model:
  name: gpt-4-turbo
  provider: openai
  temperature: 0.7

user:
  id: user_12345
  type: human
  tier: premium

session:
  id: sess_abc123
  channel: web
Violations Tab
Policy violations for this trace:
┌─────────────────────────────────────────────────────────────┐
│  Policy Violations (2)                                       │
├─────────────────────────────────────────────────────────────┤
│  ⚠ LOW: Metadata Tagging Requirements                        │
│  Policy: Required field missing: ai_app_id                   │
├─────────────────────────────────────────────────────────────┤
│  🔴 HIGH: PII Detected                                       │
│  Pattern: Email address in output                            │
│  Evidence: "user@example.com"                                │
└─────────────────────────────────────────────────────────────┘
Actions
Single Trace Actions
Right-click a trace or use the action menu:
- View Details - Open detail drawer
- Copy Trace ID - Copy to clipboard
- View in Source - Open in source platform
- Export - Download trace data
Bulk Actions
Select multiple traces using checkboxes:
- Check individual traces or "Select All"
- Use the bulk action menu:
- Export Selected - Download as JSON/CSV
- Acknowledge Violations - Mark violations as reviewed
Tips & Best Practices
1. Start Broad, Then Narrow
Begin with a wide time range, then add filters to narrow down.
2. Use Saved Presets
Save filter combinations you use regularly:
- "Production Errors (Last 24h)"
- "My Agent (Last Week)"
- "High-Cost Traces"
3. Check Violations First
When investigating issues, start with the Violations tab.
Export
Export trace data for external analysis or reporting.
Export Formats
- CSV — Spreadsheet-compatible format with one row per trace
- JSON — Complete trace data including metadata and spans
How to Export
- Apply filters to scope the data you want to export
- Optionally select specific traces with checkboxes
- Click Export in the toolbar
- Choose CSV or JSON format
- Download the file
Exports respect your current filters — only matching traces are included.
Column Customization
Customize which columns appear in the trace table:
- Click the column settings icon in the table header
- Toggle columns on or off
- Drag columns to reorder them
- Your column preferences are saved for future sessions
Next Steps
- Policy Violations - Understand violation details
- Monitoring - View aggregate metrics and trends
- Troubleshooting - Common issues and solutions